The UI5 Support Tool - Help Yourself!
30 Days of UI5 — Day 15 by DJ Adams
Building anything but the most trivial native apps (that’s web native, of course) is not an easy ride. There are so many factors to get right. Debugging one of these apps can be just as tough.
The UI5 toolkit supports many features that make building and debugging easier. One of these is the support for the separation of concerns in the form of Model-View-Controller (MVC) mechanisms. Another is the ability to use a declarative approach to define your views (no moving parts), in XML, HTML or JSON; furthermore, you can use the subview and fragment concepts to divide and conquer complexity and embrace reuse.
The Support Tool
The particular feature I wanted to talk briefly about in this post though is the Support Tool, alternatively known as “UI5 Diagnostics“, or even “the claw hand thing”. This last nickname comes from the fact that you invoke the support tool from a challenging key combination: Ctrl-Alt-Shift-S.
There’s also the Support Tool’s little brother, invoked with Ctrl-Alt-Shift-P, which is a model popup giving you a summary of the runtime context, and giving you the chance to turn on some debugging information.
You can see a shot of this here. (You can also turn on debugging via a URL query parameter sap-ui-debug=true.)
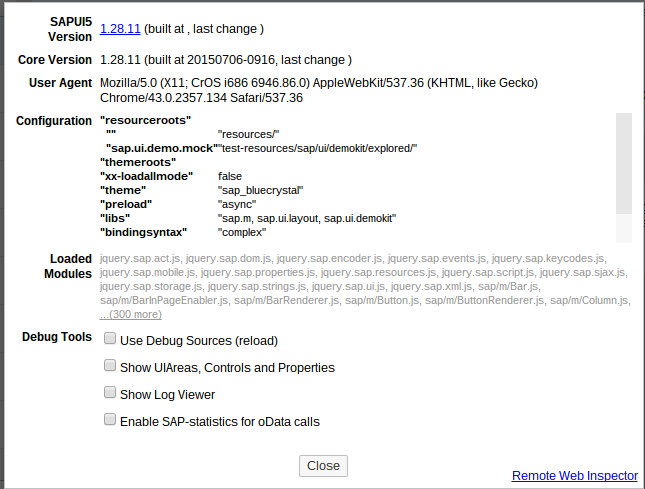
Sometimes this is all you need, especially if you want to see the UI5 version in operation, or turn on debug sources.
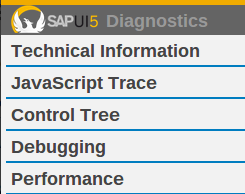
But the Support Tool is a super, multi-faceted mechanism which has proved invaluable over the years. It sports a large number of features, too many to cover here, so we’ll just have a brief look at one of them (arguably the most important) – the Control Tree:
On the left hand side there’s a super useful display of the app’s control hierarchy. This alone is worth the cost (ahem) of the Support Tool.

Imagine being able to peer into the internal structure of a building, or having X-Ray Specs and being able to see your skeleton, or sitting in front of a monitor in The Matrix and seeing the world behind the curtain. This is what you get with the Control Tree.
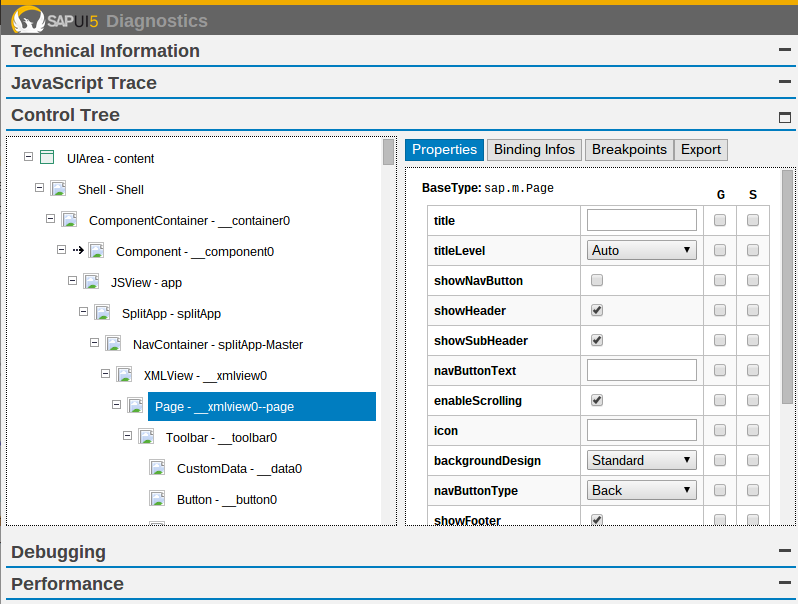
UI5 apps can have complex UI structures. Fiori apps especially so. Controls within controls, wheels within wheels in a spiral array, a pattern so grand and complex. With the Control Tree you can see and grok this structure very quickly. Note you can view at a glance what the control actually is, what it contains & what contains it, and what its ID is.
But that’s not all. On the right hand side, for a selected control (for example the Page control in the screenshot above), you can see all the properties of that control and from where in the control inheritance they come. You can modify the values for those properties and see the effect immediately, and even set breakpoints for each time the value for a particular property is read (G – get) or written (S – set).
Select the Binding Infos tab and see what bindings exist. You can see information on what model a binding is from, what type of binding it is, and of course the binding path. Here we can see some of the binding info for the List control in an app:
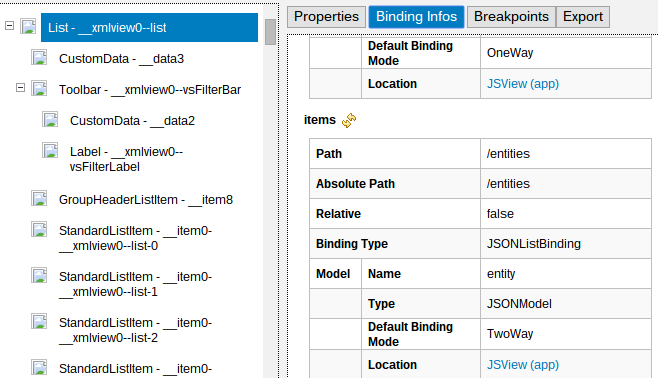
For you eagle-eyed readers, the model name here — “entity” — is the name of the domain model in this app example. Often the domain model is the unnamed model, but here it has a name. Can anyone guess what this (publically available) app is?
There’s so much to discover with the Control Tree and the rest of the Support Tool, I recommend you hit Ctrl-Alt-Shift-S the next time you’re running a UI5 apps, and start exploring.
Finishing off
Let’s finish this post off with a quick piece of trivia and a tip. If you’ve had the Chrome Developer Tools open and then open the Support Tool, you’ll notice a ton of new messages in the console, and it’s a lot more verbose. This is because when the Support Tool starts up, it sends a message to the logger to crank the logging output up to 11.
By default, the log level is set to 1 (“ERROR”). If you’re running the app with debugging on, that level is 4 (“DEBUG”). But opening the Support Tool causes this to be set to 6 (“ALL”). You can turn that down again with the jQuery.sap.log.setLevel function. Otherwise, LOG ALL THE THINGS!!1!