The SAP Fiori Launchpad as a dashboard for my running KPIs
I'm a hobby runner, and love stats. I've been experimenting with using the SAP Fiori Launchpad to surface some key performance indicators - literally! Read on to find out how I went about it, and how the SAP Fiori Launchpad could do something similar for you.
I started running a couple of years ago, and as well as being pushed on by the promise of adrenaline and endorphins, I'm also driven by the stats. How far have I run this week, and this year to date? How does that compare to this time last year? What are my highlights, my averages, and total distances?
Stats and KPIs
Originally opting for a Garmin Forerunner 110 running watch (with companion heart rate monitor strap), I now use a TomTom Runner Cardio. Both watches deliver similar functionality, which includes GPS-tracking (and therefore also distance, pace & elevation) and heart rate monitoring. Both watches therefore spit out a ton of data, which I have automatically uploaded to Endomondo, a sports tracking website, but I also maintain a Google spreadsheet with the stats. This is partly to remain somewhat independent of any particular sports tracking site, but also because the Google Apps Script platform allows me to build functions to make that data useful.
For example, I can expose spreadsheet data as JSON via my SheetAsJSON mechanism I created and wrote about back in 2013. Useful on its own, but when combined with the power of the SAP Web IDE templating for example, even better - see the video SAP Fiori Rapid Prototyping: SAP Web IDE and Google Docs below for more information on this.
The SAP Fiori Launchpad
I'm a big fan of the new User Experience (UX) that SAP is bringing to the world, in the shape of UI5 powered layers. The most obvious is of course the layer of Fiori goodness, but there's also the Fiori Launchpad (FLP) from where Fiori apps are served. I think we're just scratching the surface of this new lightweight portal. The tile concept, with the related tile groups, intents, catalog and role mechanisms is not only well thought out but also flexible enough for many situations - not just merely exposing apps to users.
I decided to combine the KPIs that I'm collecting from my running, and expose them in an FLP. It's early days, but already the visual at-a-glance layout is appealing, and with the responsive nature of the FLP (thanks to UI5) I can have it in my pocket too.
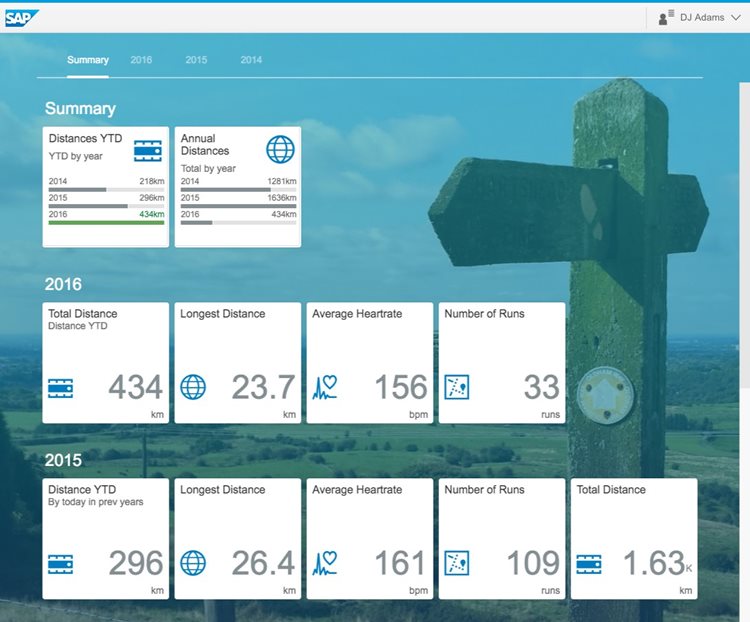
The figures you see in this screenshot are taken live and direct from the Google spreadsheet I mentioned earlier. The pointers to the values are set in the configuration of dynamic tiles in the FLP site I've created in my trial version of the SAP HANA Cloud Portal. So after I've finished a run and maintained the line of data in my spreadsheet, the aggregated information finds its way here automatically.
Now, I just happen to use a Google spreadsheet because I personally value the power and simplicity that the Google Apps platform and infrastructure has to offer. But if you have your data somewhere else, that's no problem. Of course, in a business context this is most likely going to be inside one or more of your SAP systems. And that's the simplest case. But with the flexible nature of the FLP, built on open standards such as HTTP, it's really only your imagination that is the limit.
Upcoming webinar
If this has whetted your appetite for more information on using the SAP Fiori Launchpad as a dashboard for personal or work related information, and you want to find out more about dynamic tiles and what else is possible, you'll want to attend our webinar next month:
The SAP Fiori Launchpad as a Human-Centric Dashboard
It's an hour at lunchtime (GMT) on 26 April, free to attend, and may just be what you're looking for. See you there!