OpenUI5 Walkthrough
30 Days of UI5 - day 5 by DJ Adams.
(Get to all the parts in this series via the series post.)
 Explored,
before its promotion.
Explored,
before its promotion.
OpenUI5, like its twin sibling SAPUI5, has a great SDK.
The SDK contains plenty of example code snippets, especially in the Explored app. Up until version 1.20 the Explored app was “just another” app in the Demo Apps section, but after that it was (rightly) promoted to prominence at the top level of the SDK menu structure.
The latest addition to Explored is a set of code examples that accompany a great multi-step walkthrough of many of the features and practices of UI5 development. A number of things are changing in release 1.30, including the introduction of the application descriptor, and a new way of defining modules. This walkthrough covers these topics and many others too. It’s well worth a look.
One thing that immediately caught my eye was when I selected the appropriate Explored sample that corresponded to Step 30 of the walkthrough, describing the Debugging Tools : the excellent UI5 Diagnostics Tool popped up out of nowhere!
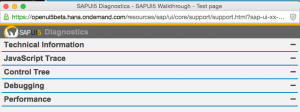
(I’m a big fan of this tool; there’s so much information it offers, as a UI5 developer you can’t afford to ignore its help.)
I was curious as to how this automatic opening of the tool had been achieved, and a quick look at the appropriate webapp/Component.js asset in the sample’s code section gave me the answer:
jQuery.sap.require("sap.ui.core.support.Support");
var oSupport = sap.ui.core.support.Support.getStub("APPLICATION"); oSupport.openSupportTool();
Nice!
- ← Previous
Creating Native Applications with UI5 - Next →
The App Descriptor