A modern and clean Neovim setup for CAP Node.js - configuration and diagnostics
In this post I describe my re-worked basic setup for working with CAP Node.js in Neovim, focusing on the configuration and digging into the LSP based diagnostic facilities.
Introduction
The advent of the latest release of Neovim (0.11) brought some changes and improvements in the area of LSP and diagnostics support, covered nicely in the post What's new in Neovim 0.11 from Gregory Anders, and also in David Kunz's video Neovim 0.11: What's New?.
I have tried to embrace the new simplified LSP features and have created a clean configuration for CAP Node.js development, predominantly the editing of CDS and JavaScript files.
For those outside the SAP ecosphere, CAP is the SAP Cloud Application Programming Model and CDS is the backbone of CAP, a collection of domain specific languages (DSLs) that include the Conceptual Definition Language (CDL), a declarative language for defining models; files containing CDL source are usually found with the extension
.cdswhich reflects the overall model.
Both JavaScript and CDS sources are supported by language servers and also by Tree-sitter. The setup of Neovim to use such facilities with a minimum of configuration and a maximum use of default keybindings and operations is my aim here.
In the following sections I'll describe the configuration and how I am using the facilities that the configuration describes, specifically the diagnostic facilities.
Configuration
The overall configuration follows what I think is a fairly standard approach, coupled with the simpler LSP setup and configuration approach in 0.11.
For the purposes of isolating and working on this configuration, I use the NVIM_APPNAME feature which lets me split out and manage separate clusters of Neovim configuration. I have a cluster named "clean", which I put together for this exercise, and for which I set NVIM_APPNAME=clean for this purpose, via a custom shell function nvc.
The file and directory structure
In the root of the "clean" configuration, here's what tree shows:
# /home/dj/.config/nvim-configs/clean
; tree
.
├── init.lua
├── lazy-lock.json
├── lsp
│   ├── cds.lua
│   ├── javascript.lua
│   └── lua.lua
├── lua
│   ├── config
│   │   └── lazy.lua
│   └── plugins
│       ├── mini.lua
│       └── treesitter.lua
└── queries
    └── cds
        ├── folds.scm
        ├── highlights.scm
        ├── indents.scm
        ├── injections.scm
        └── locals.scm

7 directories, 16 files
Briefly:
- The main configuration is in
init.lua, supported by a fairly standard configuration filelua/config/lazy.luafor the lazy.nvim plugin manager. - I'm managing language server configuration in separate files within the
lsp/directory (as described in the "simpler LSP setup and configuration" section of Gregory's blog post referenced earlier). - I have kept the plugins (in
lua/plugins/) to a minimum; a status line from theminifamily of plugins that shows LSP info (see later for an example of what this looks like) and configuration for Tree-sitter. - In the
queries/cds/directory are various query definitions to go along with the custom Tree-sitter support in tree-sitter-cds; while Tree-sitter will be able to parse and recognise symbols in the CDS sources, Neovim won't be able to assign colours to the different parts of the generated syntax tree without those queries, and no syntax highlighting will appear. The setup oftree-sitter-cds, which includes the addition of these*.scmfiles, is described in the Neovim support section of the repo.
It's perhaps worth pointing out what's not there - in particular, the nvim-lspconfig plugin, which I don't need to use now.
The entire configuration cluster (all the files above) is available to browse in my dotfiles repo.
init.lua
Here's the full content of the init.lua file:
-- PLUGIN MANAGER

require("config.lazy")

-- LANGUAGE SERVER PROTOCOL

-- LSP-based completion support
vim.api.nvim_create_autocmd('LspAttach', {
  callback = function(ev)
    local client = vim.lsp.get_client_by_id(ev.data.client_id)
    if client:supports_method('textDocument/completion') then
      vim.lsp.completion.enable(true, client.id, ev.buf, { autotrigger = true })
    end
  end
})

-- Control LSP support by filetype
vim.lsp.enable({
  'javascript',
  'cds',
  -- 'lua',
})

-- LSP logging
vim.lsp.set_log_level("WARN")

-- DIAGNOSTICS

-- How diagnostics are displayed
vim.diagnostic.config({ virtual_lines = { current_line = true } })

-- GENERAL OPTIONS

vim.opt.list = true
vim.opt.expandtab = true
vim.opt.shiftwidth = 2
vim.opt.signcolumn = "yes:1"
vim.opt.cursorline = true
vim.opt.splitright = true
vim.opt.winborder = "rounded"

-- FILETYPES

vim.filetype.add({ extension = { cds = 'cds' } })
I'll take this section by section.
Plugin manager
In the "plugin manager" section I require the lazy.nvim plugin manager configuration which is in lua/config/lazy.lua. This is very close to the standard configuration example in the lazy installation guide, I have not consciously added or changed anything there.
Language server protocol
The "language server protocol" section uses the new 0.11 features, specifically creating an LspAttach callback to check for and enable completion if the language server supports it, and enabling the configuration on a filetype by filetype basis.
The language server specific configuration itself can be found in individual files in the lsp/ directory. I have configuration files for CDS, JavaScript and Lua, and am enabling language server usage for the first two.
This is partly because I want to focus on just those two but also, with respect to Lua, I need to figure out how to "put back" that configuration that prevents warnings about
vimbeing an "undefined global":-- LSP-based completion support
W vim.api.nvim_create_autocmd('LspAttach', {
└──── undefined-global: Undefined global `vim`.
callback = function(ev)
...
endUntil I do, I've disabled the LSP connection for Lua.
Update: I found out how to do this in 0.11 - see the Prevent the Lua "undefined global" diagnostic message section in the Appendix.
Here is what lsp/javascript.lua contains:
return {
  cmd = { 'typescript-language-server', '--stdio' },
  root_markers = { 'package.json', '.git' },
  filetypes = { 'javascript' }
}
That's it! All that's needed here is information on how to invoke the actual language server executable, hints on how to find where the project ("workspace") root is, and what Neovim filetypes this configuration is for. The contents of lsp/cds.lua is similar.
Where are these language server executables? Well, one might use mason.nvim to install and manage language servers and other similar executables, but to keep things simple from a Neovim configuration perspective, I just installed them manually; for JavaScript I use typescript-language-server and for CDS I use @sap/cds-lsp, both of which are available via NPM:
npm install -g typescript-language-server @sap/cds-lspIn my dev container based Personal Development Environment (PDE) setup I have the global NPM directory set to
$HOME/.npm-packages(withnpm config set prefix "$HOME/.npm-packages), and$HOME/.npm-packages/bin/is in my$PATH, meaning that once installed, the executables from these two packages are reachable both by me and by Neovim:# /home/dj
; echo $PATH | tr ':' '\n' | grep npm-packages
/home/dj/.npm-packages/bin
# /home/dj
; which cds-lsp typescript-language-server
/home/dj/.npm-packages/bin/cds-lsp
/home/dj/.npm-packages/bin/typescript-language-server
I have a line in init.lua relating to LSP logging output:
vim.lsp.set_log_level("WARN")This "WARN" level is actually the default, but I like to leave this line in and have the option to increase the level to "INFO" or even "DEBUG" to see what's going on. The log records are written to a file called lsp.log in the $HOME/.local/state/ directory for the active Neovim configuration cluster, so in my case it's:
~/.local/state/nvim-configs/clean/lsp.logWhile I'm learning more about the protocol and what each server offers, I find it useful sometimes to keep an eye on what's going on between Neovim and the language server.
Diagnostics
In the "diagnostics" section I've included some configuration that is also from the Diagnostics part of the "What's new in Neovim 0.11" blog post.
The configuration as shown above, using virtual_lines, results in a nice display of the diagnostic messages on a separate line, with a pointer to the exact position to which the diagnostic relates. See later for a comparison of different diagnostic displays.
General options
There's only a couple of things perhaps worth pointing out in my general options.
First, there's the signcolumn value. I don't like the entire buffer content switching left and right by a character when there's a sign (such as H, W, I or E for hint, warning, info and error respectively) to be displayed, so I use yes:1 to have a permanent single character column for sign eventualities.
Then there's winborder which is new and mentioned in the Improved hover documentation section of the "What's new with Neovim 0.11" blog post. See later for what effect this has.
Filetypes
Lastly I have added an explicit line to set the filetype to cds for files ending in .cds. Without this, Neovim won't recognise and set this custom filetype for the CDS content I want to edit, and as a consequence, none of the filetype based configuration (such as for the language servers) will kick in.
Usage
With all that out of the way, here are a few notes on how I can use this configuration, specifically regarding diagnostics.
Diagnostic display
There are different ways I can have Neovim share diagnostic information with me.
In all the following samples, the symbol for which the diagnostic has been raised is actually underlined by default in Neovim, for example
book(inbook.stock) on the line with theEin the sign column would be underlined in the first example here; I just can't get it to render as underlined in this code block rendered from Markdown.Incidentally, this underline feature belongs to the "family" of diagnostic display options, along with virtual text, virtual lines and signs. If you really want to, you can turn underlining off in this context by including
underline = falsein the table of options passed tovim.diagnostic.config().
Floating window
Without any explicit call to vim.dianostic.config() in my configuration, diagnostic signs are shown in the sign column, the relevant part of the line is underlined, but no diagnostic detail is displayed at all by default, even if my cursor is on that line:
    this.after('each', ListOfBooks, book => {
E     if book.stock > 111) book.title += ` -- 11% discount!`
    })

    // Reduce stock of ordered books if available stock suffices
    this.on('submitOrder', async req => {
Prior to 0.11 diagnostic detail would be displayed for every line, all at once, as virtual text (see below), which was a little too much; now, the default is not to do that.
To summon the diagnostic detail when I'm on that line I can use the default keymap binding C-w d to "show diagnostic under cursor", which then appears like this (with the rounded border decoration thanks to the winborder configuration shown earlier):
    this.after('each', ListOfBooks, book => {
E     if book.stock > 111) book.title += ` -- 11% discount!`
    })   ╭───────────────────────╮
         │Diagnostics:           │
    // Re│1. '(' expected. [1005]│ks if available stock suffices
    this.╰───────────────────────╯eq => {
      let { book:id, quantity } = req.data
See later in this section, where I look at some CDS sources, for an example of how to invoke this floating window manually.
Virtual text
Virtual text is the vivid text displayed to the right of the source lines, and with:
vim.diagnostic.config({ virtual_text = true })the diagnostic detail is shown for any and all lines, all the time (which is how diagnostic detail was displayed by default prior to 0.11):
    this.after('each', ListOfBooks, book => {
E     if book.stock > 111) book.title += ` -- 11% discount!`     ■ '(' expected.
    })

    // Reduce stock of ordered books if available stock suffices
E   this.on(;submitOrder', async req => {     ■■■ Unterminated string literal.
      let { book:id, quantity } = req.data
While there are just two errors shown in this example, with more it can get a little too "busy" so this is not a configuration option I use.
Replacing the scalar true value with { current_line = true } like this:
vim.diagnostic.config({ virtual_text = { current_line = true } })causes any diagnostic detail to be displayed as virtual text but only for the line you're on; in this following example, the same two errors exist as before, but the cursor is on the this.on( ... ) line:
    this.after('each', ListOfBooks, book => {
E     if book.stock > 111) book.title += ` -- 11% discount!`
    })

    // Reduce stock of ordered books if available stock suffices
E   this.on(;submitOrder', async req => {     ■■■ Unterminated string literal.
      let { book:id, quantity } = req.data
Note, as shown here, that by default the signs will always be displayed in the sign column for all relevant lines.
Virtual lines
Changing the configuration property from virtual_text to virtual_lines causes the diagnostic detail to be displayed on a separate line, with a thin pointer to the specific problematic position; here's an example based on the actual configuration I have in init.lua, i.e. using virtual lines but only displaying the diagnostic detail for the line I'm currently on (which here is the one with this.on( ... ) again):
    this.after('each', ListOfBooks, book => {
E     if book.stock > 111) book.title += ` -- 11% discount!`
    })

    // Reduce stock of ordered books if available stock suffices
E   this.on("submitOrder', async req => {
                                         └──── 1002: Unterminated string literal.
E     let { book:id, quantity } = req.data
E     let book = await SELECT.one.from (Books, id, b => b.stock)
Note that while diagnostic detail is indeed only displayed for the line I'm on (e.g. it's not displayed for the first error where there's a missing opening bracket for the if condition), there could be multiple virtual lines displayed for a single line of course, depending on the knock-on effects of the actual issue.
There's an example of multiple virtual lines later in the Diagnostic severity order section, and both Gregory and David cover virtual lines nicely in their post and video respectively too.
Here's how I see the pros and cons of each of these diagnostic detail display approaches:
| Detail display | For | Against |
|---|---|---|
| Floating window | Neat, and can usually see all the detail | Have to use an explicit keybinding to invoke |
| Virtual text | Source code remains stable | Sometimes the detail displayed is off the right hand edge of the buffer |
| Virtual lines | More of the detail is available to read, and there's a nice pointer to the relevant position | Causes the source code to jump up and down |
Note that the option to have diagnostic detail displayed just on the current line (vs all lines all the time) is available for both virtual text and virtual lines.
For now I'm going with virtual lines, with diagnostic detail displayed on the current line only; that's what the configuration shown in my init.lua above declares, too.
By the way, all the examples above have been based on JavaScript sources. Here's an example of a CDS source, where there are three diagnostics - one warning and two error. The cursor is on the entity Books : managed { line:
W using { Currency, sap, Language } from '@sap/cds/common';
  namespace sap.capire.bookshop;

E entity Books : managed {
                 └──── ref-undefined-art: No artifact has been found with name “managed”
E   key ID  Integer;
    @mandatory title  : localized String(111);
    descr  : localized String(1111);
(The warning is an unused-artifact-import diagnostic for the imported Language type and the other error is a syntax-unexpected-token caused by a missing colon between ID and Integer).
While we're in this file, let's look at how to invoke the floating window with the diagnostic detail, which would normally be done with C-w d:
W ╭────────────────────────────────────────────────────────────────────────────────────────────╮
  │Diagnostics:                                                                                │
  │1. Mismatched ‹Identifier›, expecting ‘:’, ‘;’, ‘{’, ‘}’, ‘@’, ‘=’ [syntax-unexpected-token]│
E ╰────────────────────────────────────────────────────────────────────────────────────────────╯
E   key ID  Integer;
            └──── syntax-unexpected-token: Mismatched ‹Identifier›, expecting ‘:’, ‘;’, ‘{’, ‘}’, ‘@’, ‘=’
    @mandatory title  : localized String(111);
    descr  : localized String(1111);
    @mandatory author : Association to Authors;
 N  Diag E4 W1 LSP +  cap/db/schema.cds[+]                                                                cds  29|55│ 1|18
:lua vim.diagnostic.open_float()
You can see in the command line that the floating window (independent of the virtual lines already displayed) is opened with vim.diagnostic.open_float() .
Diagnostic summary in the statusline
The statusline configuration in lua/plugins/mini.lua is simple but the effect is very useful; here's what it looks like with icons enabled:
![]()
and with them disabled:
![]()
From left to right this status line shows that I'm currently in "Normal" mode, there are two "error" level diagnostics and one "hint" level diagnostics in the current buffer, and that there is one LSP server attached.
See also the LSP health check section in the Appendix.
Diagnostic severity order
There's only space for a single diagnostic severity indicator (W, E etc) in the sign column on each line. But if there are multiple problems on a single line, this is what could appear (my cursor is on the entity Books line):
W using { Currency, sap, Languages } from '@sap/cds/common';
  namespace sap.capire.bookshop;

E entity Books : managed {
                 └──── ref-undefined-art: No artifact has been found with name “managed”
E   key ID  Integer;
    @mandatory title  : localized String(111);
Because I use the sign column to get an at-a-glance summary of what's going on with my code, I would think that the highest diagnostic severity on the first line was a "warning".
But in fact there's an "error" level diagnostic too, which is revealed along with the "warning" level diagnostic when I move my cursor to the first line to cause the virtual lines to be displayed:
W using { Currency, sap, Languages } from '@sap/cds/common';
                         ├──── unused-artefact-import: Imported artefact 'Languages' is not used in this source file
                         └──── ref-undefined-def: Artifact “Languages” has not been found
  namespace sap.capire.bookshop;

E entity Books : managed {
E   key ID  Integer;
    @mandatory title  : localized String(111);
The unused-artefact-import is the "warning" level diagnostic, and the ref-undefined-def is the "error" level diagnostic.
These diagnostic detail lines are actually coloured differently in Neovim itself (warnings in yellow and errors in red) but that colour is not conveyed in these Markdown code block based text representations here (I'm trying to avoid too many non-searchable screenshots).
I can address this problem with the severity_sort diagnostic option; if I extend my diagnostic configuration in init.lua to look like this:
  vim.diagnostic.config({
    virtual_lines = { current_line = true },
    severity_sort = true
  })
then the sign for the first line is shown as E rather than W, and the virtual lines are re-ordered too:
E using { Currency, sap, Languages } from '@sap/cds/common';
                         ├──── ref-undefined-def: Artifact “Languages” has not been found
                         └──── unused-artefact-import: Imported artefact 'Languages' is not used in this source file
  namespace sap.capire.bookshop;

E entity Books : managed {
E   key ID  Integer;
    @mandatory title  : localized String(111);
Diagnostic navigation
There are different ways that you can look at and get to the diagnostics in your code.
Jumping between diagnostics
Version 0.11 introduced more default key mappings; many of them are square-bracket based and related to navigation and inspired by Tim Pope's vim-unimpaired plugin. There are a couple of pairs for moving between diagnostics in a buffer:
| Key mapping | Action |
|---|---|
[d, ]d | Jump to prev, next diagnostic |
[D, ]D | Jump to first, last diagnostic |
Using the quickfix list
There isn't a default key mapping for this, but with vim.diagnostic.setqflist() you can ask for all the diagnostics to be put in the quickfix list, which is great for an overall display and to jump between them using standard quickfix actions; what's more, some of the new default key mappings make this even more comfortable:
[q,]q,[Q,]Q,[CTRL-Q,]CTRL-Qnavigate through the quickfix list
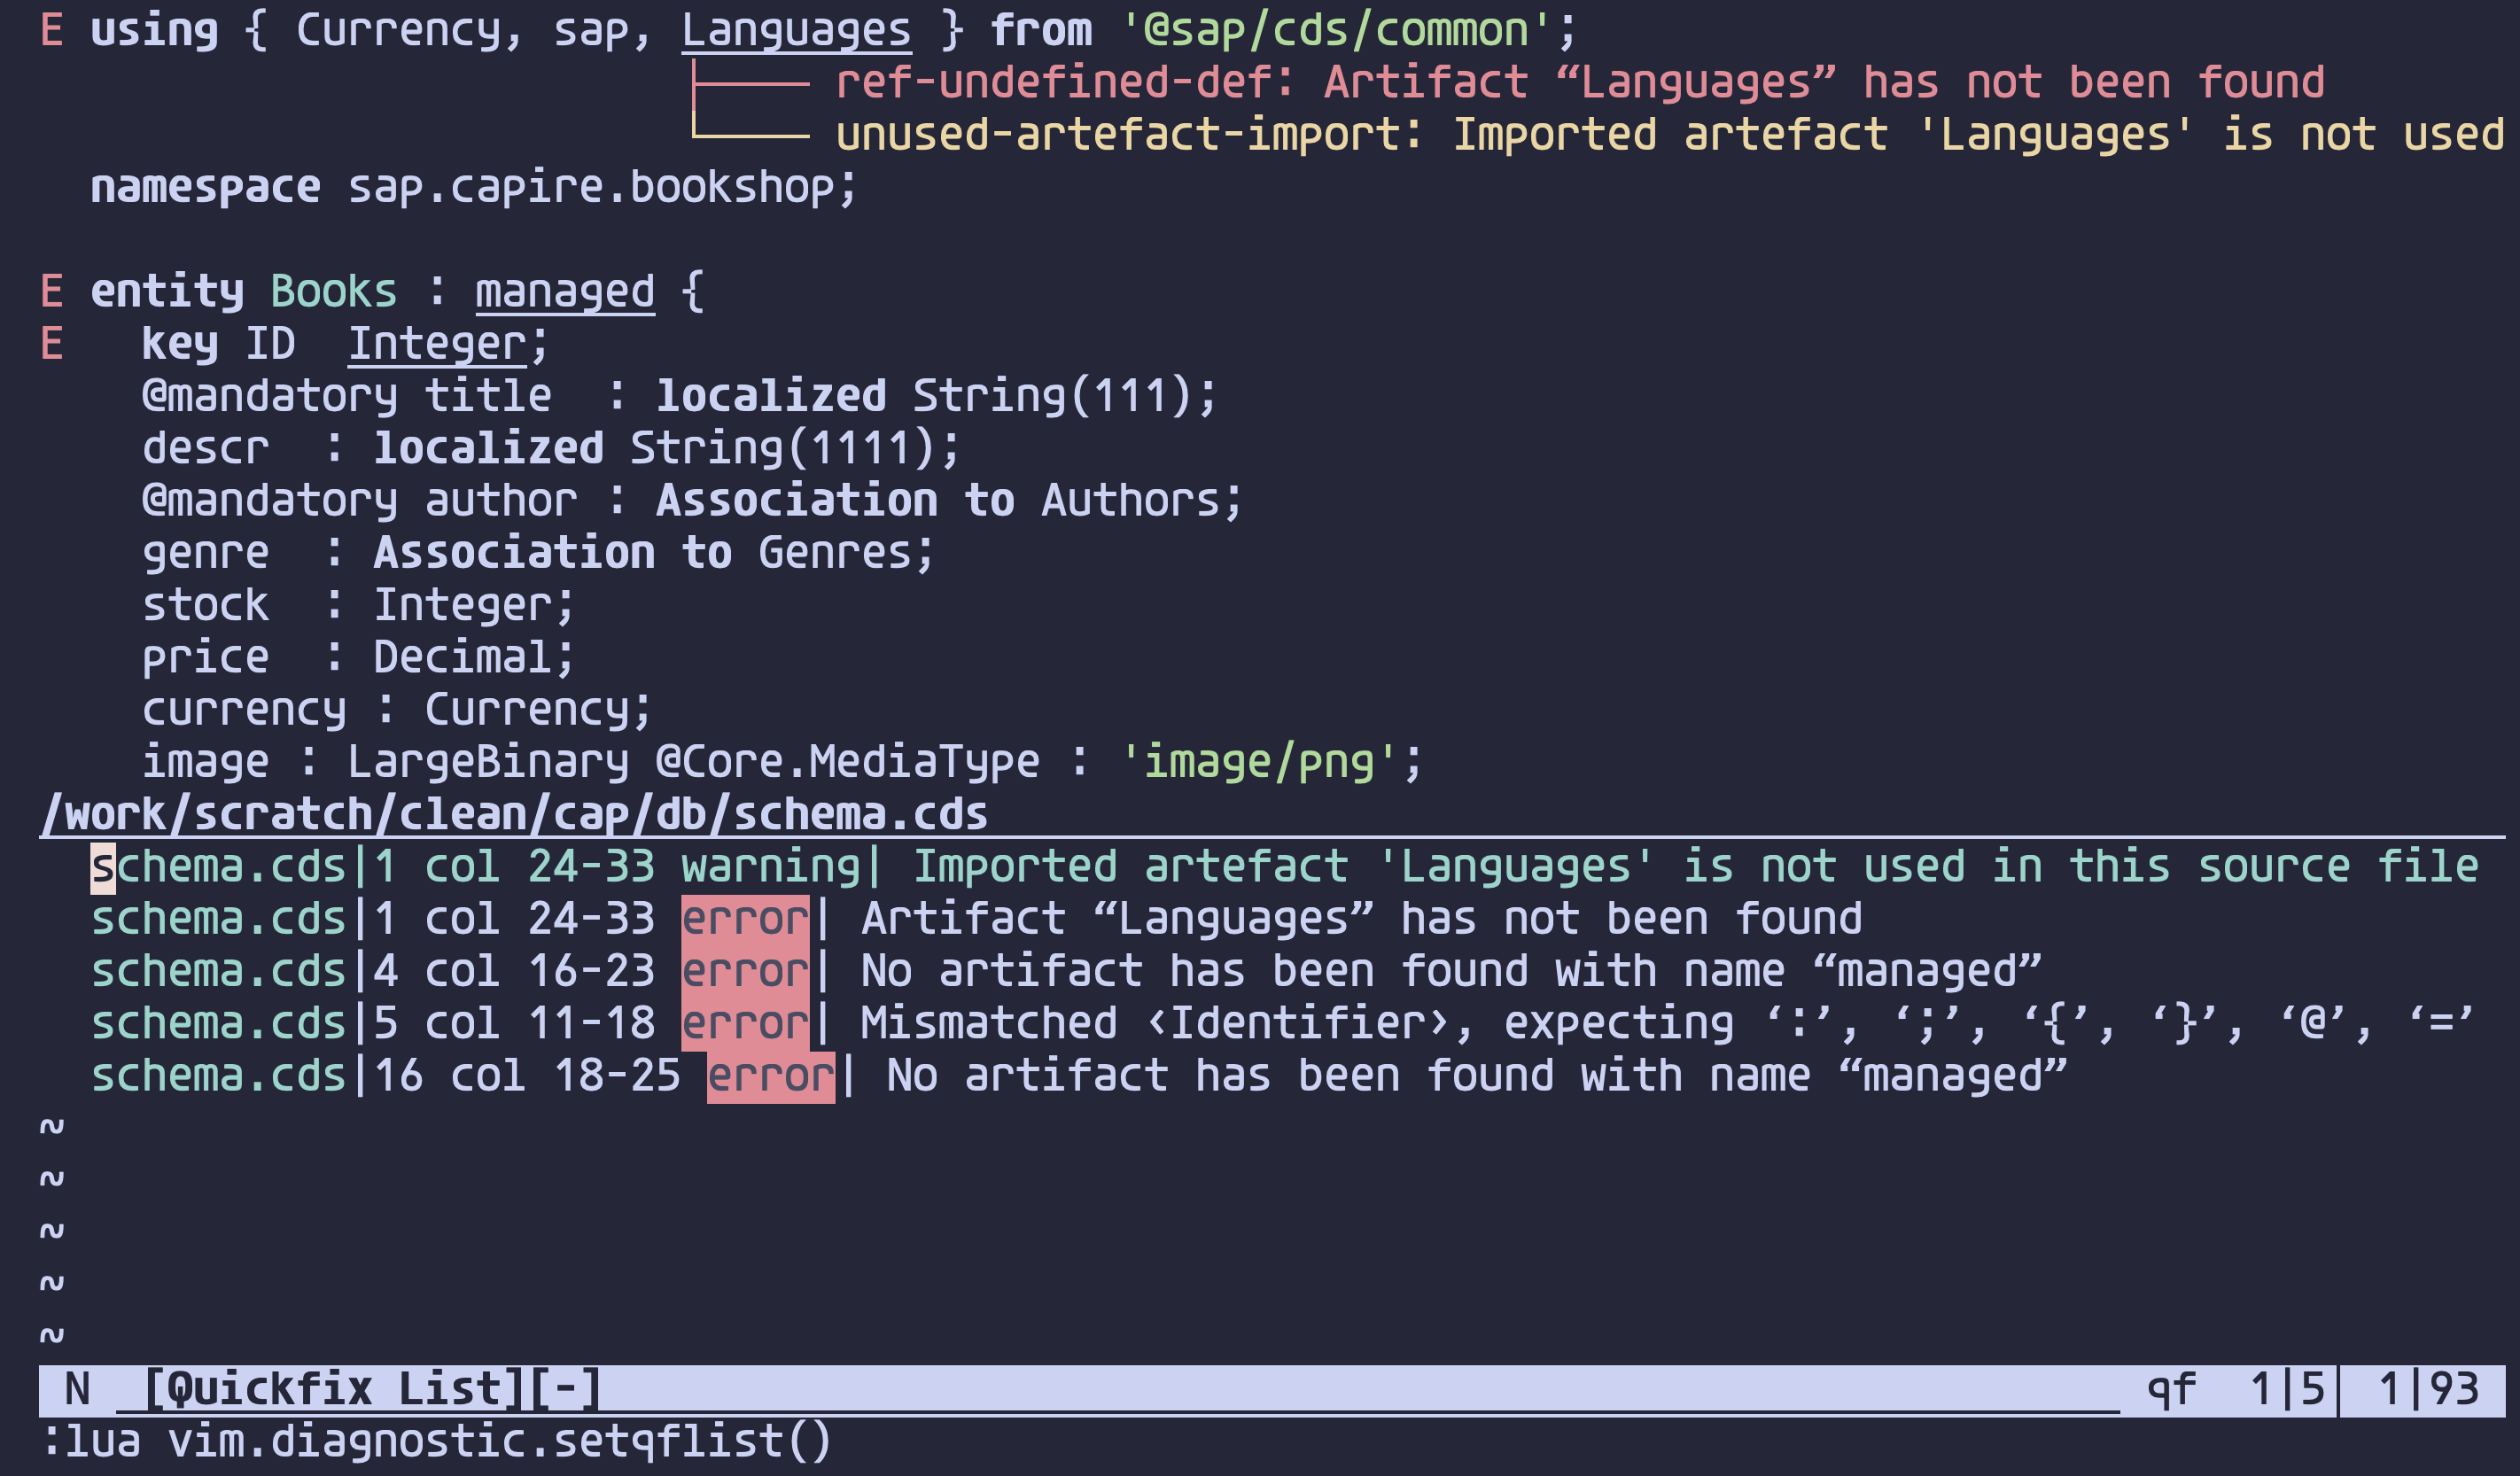
Here's what the quickfix list looks like for the diagnostics in that CDS file; at this point I've just invoked :lua vim.diagnostic.setqflist() and I'm on the first line in the quickfix list which is the "warning" level item:
This could easily be configured as a key mapping for e.g. <leader>dq (for "diagnostics into quickfix list") like this:
vim.keymap.set('n', '<leader>dq', vim.diagnostic.setqflist)If you're a user of Telescope you may know there's a similar facility to show a nice navigable list of the diagnostics, with
builtin.diagnostics.
Wrapping up
I've come to a point where it makes sense to finish this post. There's plenty more to learn about with respect to diagnostics, and the standard Diagnostic documentation is great, I'd recommend you have a coffee-time browse through at some point.
If you want to try out this exact setup without messing up your current config, or are just curious to see how it feels, I've set up a repo on GitHub called neovim-modern-clean-cap-nodejs that has a dev container definition so you can create a codespace from it, ssh to it, and run Neovim with this config. All the instructions are in the repo's README.
Until next time, happy editing!
See also
- Excluding specific diagnostics in Neovim
- Neovim configuration for file and module navigation in CDS models
Appendix
LSP health check
While my statusline does a good job of summarising the LSP facilities in play for the current buffer, I can get more info with the checkhealth command, for which there's a specific option to check the health of the LSP submodule in Neovim: checkhealth vim.lsp. Here's what that shows when I invoke it from a buffer that I've loaded a CDS source file into, and where there's the CDS language server attached:
  ==============================================================================
  vim.lsp:                                                                    ✅

  - LSP log level : WARN
  - Log path: /home/dj/.local/state/nvim-configs/clean/lsp.log
  - Log size: 123 KB

  vim.lsp: Active Clients
  - cds (id: 1)
    - Version: 9.0.1
    - Root directory: /work/scratch/clean/cap
    - Command: { "cds-lsp", "--stdio" }
    - Settings: {}
    - Attached buffers: 1

  vim.lsp: Enabled Configurations
  - cds:
    - cmd: { "cds-lsp", "--stdio" }
    - filetypes: cds
    - root_markers: package.json, .git

  - javascript:
    - cmd: { "typescript-language-server", "--stdio" }
    - filetypes: javascript
    - root_markers: package.json, .git


  vim.lsp: File Watcher
  - file watching "(workspace/didChangeWatchedFiles)" disabled on all clients

  vim.lsp: Position Encodings
  - No buffers contain mixed position encodings

~
 Normal  health://[-]                                                                                                     checkhealth  1|34│ 1|0
This is very useful to keep an eye on what's going on in the language server mechanisms of Neovim.
Prevent the Lua "undefined global" diagnostic message
Here's how to prevent the "undefined global" diagnostic message for "vim" appearing when editing Lua files:
vim.lsp.config("lua", {
  settings = {
    Lua = {
      diagnostics = {
        globals = { "vim" }
      }
    }
  }
})
Having just read the example vim.lsp.config code in the lsp-quickstart section of the Neovim documentation, I see it's also possible (and preferable, I think) to add this directly to the table of settings for the language server itself, i.e.:
return {
  cmd = { 'lua-language-server' },
  root_markers = { 'package.json', '.git' },
  filetypes = { 'lua' },
  settings = {
    Lua = {
      diagnostics = {
        globals = { "vim" }
      }
    }
  }
}